Want a Treat instead of a Trick on Halloween this year? The team at YourLocalSecurity.com (YLS) did some research to determine which US metro areas are the safest to take your costume-cloaked kiddos around the neighborhood with their pumpkin pails in 2018.
The team analyzed four data points—percent of trick-or-treaters, pedestrian car deaths, violent crime rates, and the ratio of sex offenders—to determine the most and least safe cities for your trick-or-treating clan. So before heading out with the fam at dusk this Halloween, check out the report below to see how your state’s metro areas faired.
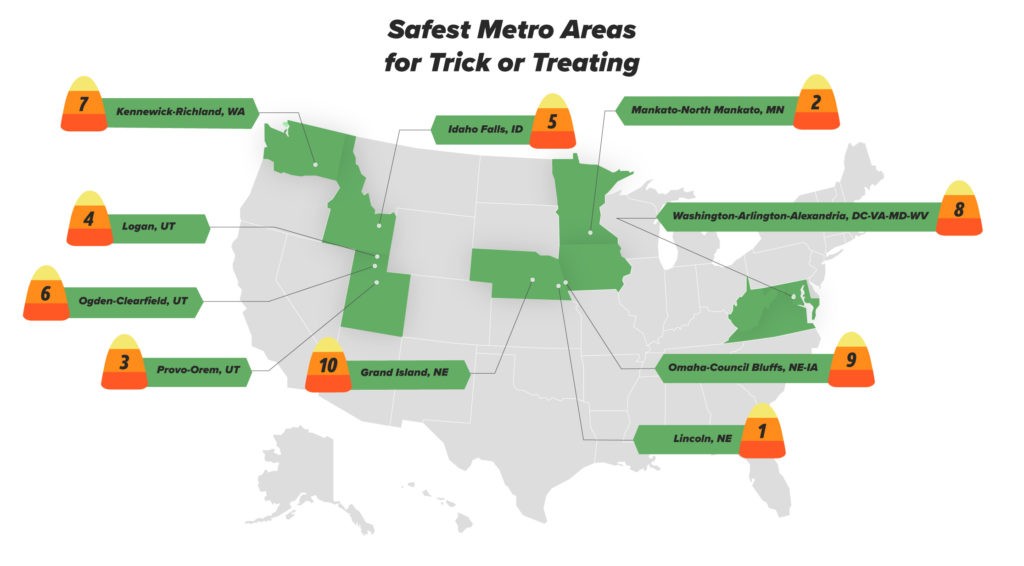
10 Safest Metro Areas
- Lincoln, NE
- Mankato-North Mankato, MN
- Provo-Orem, UT
- Logan, UT
- Idaho Falls, ID
- Ogden-Clearfield, UT
- Kennewick-Richland, WA
- Washington-Arlington-Alexandria, DC-VA-MD-WV
- Omaha-Council Bluffs, NE-IA
- Grand Island, NE
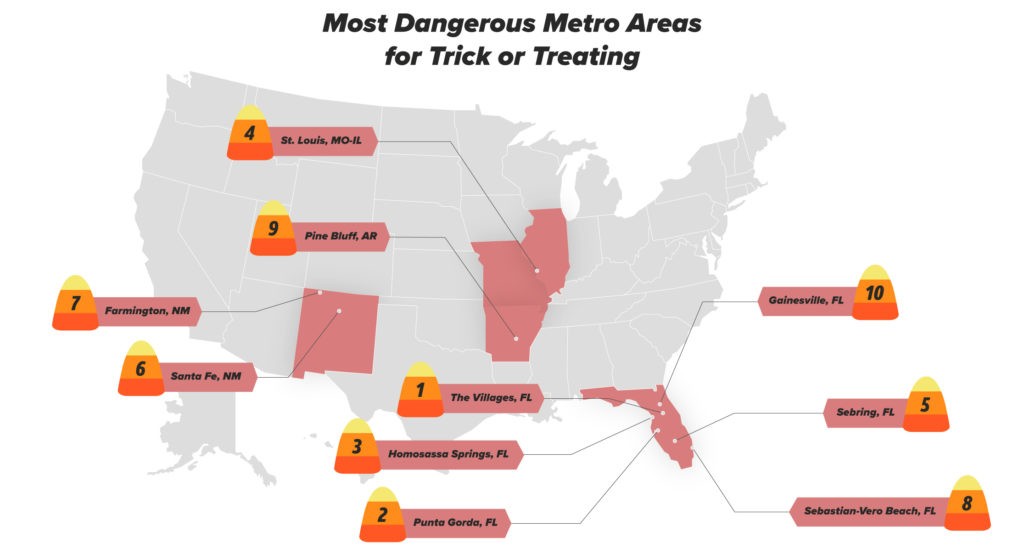
10 Most Dangerous Metro Areas
- The Villages, FL
- Punta Gorda, FL
- Homosassa Springs, FL
- St. Louis, MO-IL
- Sebring, FL
- Santa Fe, NM
- Farmington, NM
- Sebastian-Vero Beach, FL
- Pine Bluff, AR
- Gainesville, FL
Data Highlights
-
- Nebraska and Utah were among the safest states for trick-or-treating, with each state having 3 metro areas in the Top 10.
-
- Provo-Orem, UT has the highest percentage of kids at 19.2%.
-
- Nebraska has the lowest rate of pedestrian deaths at 0.63 per 100,000 residents.
-
- Three of the four Nebraska metro areas fall in the top 10, and Lincoln, NE had the lowest rate of sex offenders with 1 sex offender for every 34,009 residents.
-
- New York-Newark-Jersey City has the lowest violent crime per capita was with 0.01 violent crimes per 100,000 people. It ranked 100 overall.
-
- Florida has 6 metro areas in the bottom 10, including all 3 at the very bottom. In fact, The Villages, FL has the lowest percentage of kids at 4% and Homosassa Springs, FL had the highest rate of sex offenders with 1 sex offender for every 33 residents.
-
- St. Louis, MO-IL has the highest violent crime rate at 19.13 per 100,000 residents.
-
- New Mexico has the highest rate of pedestrian deaths at 3.51 per 100,000 residents.
Each State’s Safest Metro Area
| State Name | State’s Safest Metro Area for Trick-or-Treating | Metro Area’s Ranking (out of 383) |
|---|---|---|
| Alaska | Anchorage | 115 |
| Alabama | Daphne-Fairhope-Foley | 328 |
| Arkansas | Little Rock-North Little Rock-Conway | 81 |
| Arizona | Tucson | 263 |
| California | Visalia-Porterville | 71 |
| Colorado | Greeley | 46 |
| Connecticut | Bridgeport-Stamford-Norwalk | 85 |
| Delaware | Dover | 340 |
| Florida | Port St. Lucie | 233 |
| Georgia | Atlanta-Sandy Springs-Roswell | 193 |
| Hawaii | Urban Honolulu | 243 |
| Iowa | Des Moines-West Des Moines | 13 |
| Idaho | Idaho Falls | 5 |
| Illinois | Peoria | 56 |
| Indiana | Fort Wayne | 36 |
| Kansas | Wichita | 51 |
| Kentucky | Elizabethtown-Fort Knox | 142 |
| Louisiana | Lafayette | 299 |
| Massachusetts | Springfield | 97 |
| Maryland | California-Lexington Park | 117 |
| Maine | Lewiston-Auburn | 103 |
| Michigan | Grand Rapids-Wyoming | 94 |
| Minnesota | Mankato-North Mankato | 2 |
| Missouri | Springfield | 130 |
| Mississippi | Hattiesburg | 181 |
| Montana | Billings | 55 |
| North Carolina | Raleigh | 157 |
| North Dakota | Bismarck | 47 |
| Nebraska | Lincoln | 1 |
| New Hampshire | Manchester-Nashua | 90 |
| New Jersey | Vineland-Bridgeton | 184 |
| New Mexico | Las Cruces | 349 |
| Nevada | Las Vegas-Henderson-Paradise | 308 |
| New York | Syracuse | 144 |
| Ohio | Columbus | 40 |
| Oklahoma | Tulsa | 191 |
| Oregon | Salem | 91 |
| Pennsylvania | Lancaster | 62 |
| Rhode Island | Providence-Warwick | 96 |
| South Carolina | Hilton Head Island-Bluffton-Beaufort | 302 |
| South Dakota | Sioux Falls | 11 |
| Tennessee | Knoxville | 131 |
| Texas | Laredo | 67 |
| Utah | Provo-Orem | 3 |
| Virginia | Roanoke | 132 |
| Vermont | Burlington-South Burlington | 44 |
| Washington | Kennewick-Richland | 7 |
| Wisconsin | Appleton | 21 |
| West Virginia | Charleston | 170 |
| Wyoming | Casper | 25 |
Methodology
The YLS team looked at all 383 US metro areas, analyzing four main points of data to determine trick or treat safety: percent of trick-or-treaters, pedestrian car deaths, violent crime rates, and the ratio of sex offenders. All data points were weighted equally. Definitions are as follows:
- Percent of Trick-or-Treaters: The percentage of the population between ages 5 and 14, according to the 2016 American Community Survey 1 Year Estimates. Given that there may be safety in numbers when trick-or-treating, a higher percentage of children in a metro area contributed to a better score.
- Pedestrian Car Deaths: The number of pedestrian fatalities per 100,000 people by state, according to the NHTSA 2016 data. An average of all states included in the metro area is used when the metro area crosses state lines. A higher rate contributed to a lower score.
- Violent Crime: The number of violent crime occurrences per 100,000 people by metro area, according to the 2016 FBI crime report. When data was unavailable for a metro area, the crime rate for the principal city in the area was used. A higher rate contributed to a lower score.
- Sex Offenders: The number ratio of registered sex offenders to non-sex offenders, according to state and local agencies. The principal city in each metro area was used. A higher ratio of sex offenders contributed to a lower score.
About YourLocalSecurity.com
YourLocalSecurity.com aims to provide the security tools and information needed to build a safer home environment. For media inquiries, please contact media@yourlocalsecurity.com.